4 Biological Data: Origin, Variability, and Rigor
Before analyzing a specific biological dataset, it is important to consider the origin of the data. Biological data do not simply exist; they are generated through biological processes, experimental design choices, measurement instruments, protocols, and human decisions. As a result, the biological signals of interest in a dataset are always entangled with other biological processes, as well as with technical and procedural effects (Fig. 4.1).
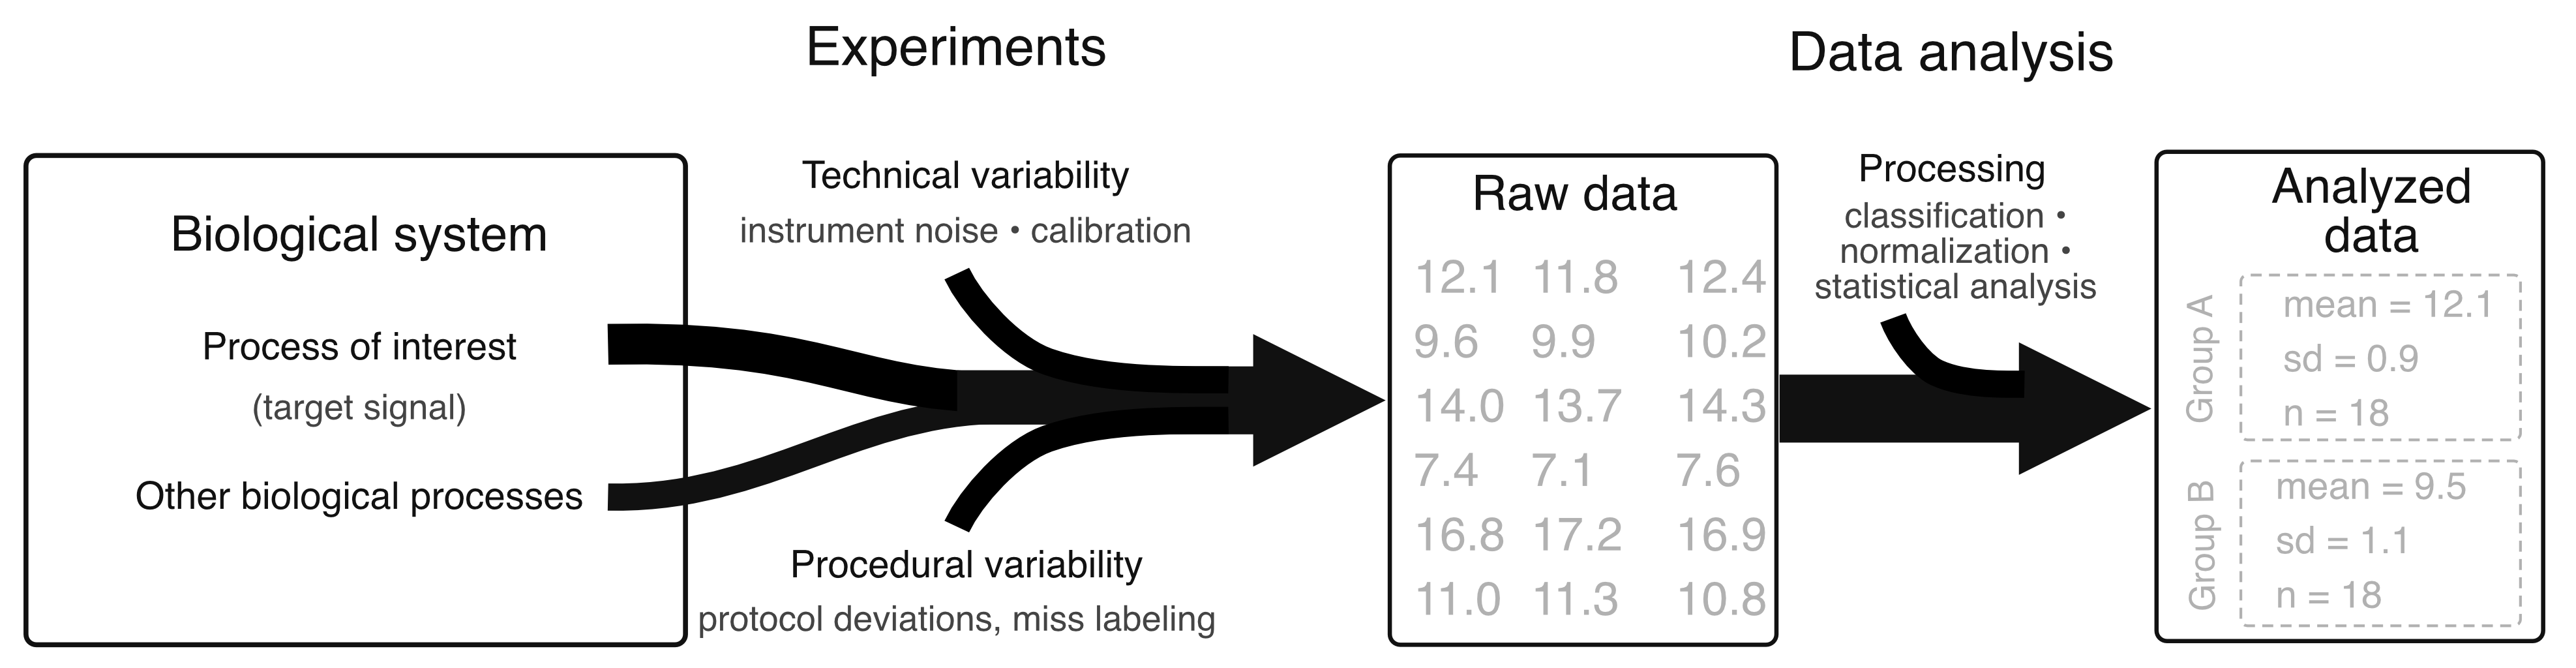
Disentangling these contributions is a central task of quantitative data analysis and essential to gain meaningful biological insight.
To approach this disentanglement problem, it is useful to distinguish different sources of variability that jointly shape observed data:
Technical variability: Variability introduced by measurement instruments and detection processes, such as detector noise, calibration uncertainty, or instrument drift.
Procedural variability: Variability arising from experimental execution and laboratory practice, including batch effects, reagent changes, or undocumented protocol deviations.
Biological variability: Intrinsic variability within and between cells, organisms, or populations. This includes variability arising from the biological process of interest as well as from other biological processes.
While technical, procedural, and unwanted biological variability are unavoidable, careful experimental design and measurement practices can limit their impact, increasing the extent to which observed data reflect the biological process of interest.
Unwanted variability is often referred to as noise. However, it is important to recognize that this term is used in several contexts: to describe random measurement fluctuations, stochastic biological processes (e.g. gene expression noise), or more loosely anything that obscures a biological signal of interest.
Often, noise is implicitly treated as random and unbiased, in which case its impact can be reduced through replication and appropriate statistical analysis. However, not all unwanted variability is random. Some sources introduce systematic bias, which shifts measurements in a consistent direction and cannot be eliminated by increasing sample size alone. For example, calibration errors can lead to systematic misestimations that persist across replicates.
Finally, every biological measurement reflects the combined influence of multiple biological and technical processes, not just the process of interest. For these reasons, we use variability as the more general term, encompassing both random fluctuations and systematic effects.
This leads to a simple but fundamental realization: good data analysis requires good data. Statistical methods can quantify uncertainty and variability in data, as we will discuss in later sections on statistics and uncertainty, but they cannot compensate for bad data generation and recover information that was not appropriately measured.
How to obtain high-quality biological data is beyond the scope of this class. However, it is important to recognize that a wide range of complementary strategies are commonly used in biological research to manage variability and improve data quality. These strategies have often been developed by groups and entire research communities over decades.
Obtaining high-quality data requires coordinated choices across experimental design, measurement, data processing, and data analysis.
Experimental design: replication, randomization, appropriate controls
Measurement: calibration procedures, spike-ins, reference samples
Data processing: normalization, filtering, background correction
Data analysis: batch correction; models that explicitly account for structured variability (e.g. mixed or hierarchical models)
Documentation: metadata collection, protocol versioning, sample annotation
Rigorous quantitative analysis requires a working understanding of how data were generated, processed, and documented. This can become challenging when analyzing data generated by other researchers, including colleagues, collaborators, or large consortia, where many experimental decisions are not directly visible in the dataset itself.
For published datasets, a careful reading of the methods section in a paper is often a crucial starting point. Key aspects to consider include how samples were collected and measured, what constitutes biological versus technical replicates, and whether randomization, or other sample selection strategies were used. Details on preprocessing steps, such as normalization, filtering, or background correction, are particularly important to correctly analyze data from others, as are clear definitions of units and detailed experimental conditions used. Methods sections also contain critical information about data availability, metadata, and prior statistical analyses.
4.1 The importance of rigor and reproducibility
To emphasize the importance and challenges of good data generation, let us briefly discuss more broadly rigor and reproducibility.
Rigor and reproducibility are the key elements of good scientific practice. They enable the evaluation of competing hypotheses, support the accumulation of reliable knowledge, and allow scientific results to be meaningfully compared, extended, and reused. In practice, however, high standards of rigor and reproducibility are not always met. While cases of deliberate scientific misconduct and fraud regularly ripple through the media and damage the reputation of science, they represent only a small fraction of a larger reproducibility problem. Far more common are unintentional failures of reproducibility arising from incomplete documentation, missing metadata, unclear statistical reasoning, or unrecognized sources of systematic variability.
Example cell line contamination: A well-known example from cell biology is the widespread use of misidentified or contaminated cell lines, often referred to as the “HeLa crisis.” Beginning in the 1960s, it became clear that HeLa cells had contaminated many other human cell cultures. Subsequent systematic investigations revealed that a substantial fraction of widely used cell lines were misidentified or contaminated, leading to systematic errors that propagated through the literature. Although authentication practices have improved substantially since the 1960s, such issues continue to occur.
More generally, failures of reproducibility often arise from missing verification steps, analytic flexibility, or insufficient standardization.
Recurring challenges for reproducibility in biological research
Cell line misidentification and contamination Insufficient verification of biological materials led to experiments being performed on unintended biological systems, with systematic errors propagating across many studies.
Reagent variability (the “antibody problem”) Differences in specificity or affinity between antibody lots, combined with poor documentation, have repeatedly compromised reproducibility across laboratories.
Unclear biological replication (pseudoreplication) Treating multiple measurements from the same biological sample (e.g. cells from one animal, images from one culture) as independent replicates has inflated statistical support in many studies.
Undocumented analytic flexibility In complex biological analyses, multiple reasonable preprocessing and analysis choices exist. When these choices are not transparently reported, results may depend strongly on the chosen analysis path, limiting reproducibility and validation.
Such failures do not merely invalidate individual studies; they can mislead entire subfields and result in substantial loss of time, resources, and scientific opportunity. Addressing these challenges therefore requires systematic attention to rigor, transparency, and reproducibility throughout the research process.
Encouragingly, awareness of these issues has increased substantially.
4.2 The importance of dataset comparisons
As underscored by the cell line contamination example, even careful adherence to established standards of rigor and reproducibility does not guarantee that all relevant sources of variability or bias are known or under proper control.
This raises a fundamental question: how can we determine whether a dataset is good enough to analyze, and what can we reasonably learn from it? Detailed knowledge of experimental context, documentation, and known sources of variability is essential for assessing whether data were generated rigorously. However, this information might not be sufficient.
At first glance, this may sound discouraging. Yet these limitations also point toward a more constructive perspective on scientific progress. Robust biological insight rarely emerges from a single dataset in isolation. Instead, it arises when patterns recur across independent experiments, laboratories, time points, and experimental approaches. Replication at the level of entire studies—and convergence across diverse methodologies—provides strong evidence that an observed pattern reflects a genuine biological phenomenon rather than an artifact of a particular system or analysis.
From a quantitative perspective, comparing and integrating data across studies is key. Meta-analyses, cross-study comparisons, and the integration of datasets generated at different times, in different laboratories, or using different experimental approaches allow reproducible patterns to emerge that are often invisible in individual experiments. When done carefully, such analyses turn variability itself into a source of information—helping to distinguish robust biological structure from context-dependent or technical effects.